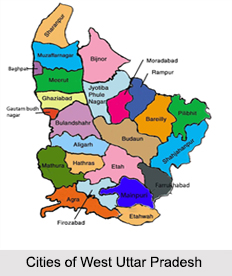
Following the tradition of Indian subcontinent, in the state of Uttar Pradesh also numerous towns and cities have developed over the years. Katghar Lalganj is one such significant town. It is the name of a nagar panchayat town, which is located in the district of Azamgarh of the same state of India.
A handful of demographers have devoted their time in gathering data that are related to Katghar Lalganj town`s demography. They religiously believe that no study about a place would complete unless and until they get acquainted with the demographical condition. According to them, the Census report that has been issued forth in the year 2001 is one of the most significant demographical documents of Katghar Lalganj. From this report if one desires one can catch hold of data like literacy rate, population condition etc. As per this report , the total population of Katghar Lalganj has been enumerated to be
11,810. Just like many other places, number of males is more than females. In other words, male populace constitutes 51 percent of the population. 49 percent is the rate of female literacy of Katghar Lalganj. Children who fall into the age group below six years of age constitute of 18 percent of the total population of Katghar Lalganj.
Literacy rate of Katghar Lalganj is vital information, which also can be deciphered from this report. It is noted that the average literacy rate of Katghar Lalganj constitutes 59 percent, which is slightly lower than India. 59.5 percent is the average literacy rate of India. Out of it, male literacy constitutes 66 percent. However rate of female literacy is less constituting 51 percent.
 Due to integrity with Azamgarh, this Katghar Lalganj also follows the same tradition. Main industries include chemicals, food, Benarasi sarees, and black potteries.
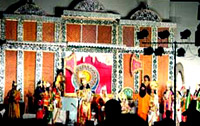
Songs and dances form a part and parcel of the people of this district. People gets enthrall with the mood of varied dance forms like Nautanki, Ramlila, Krishnalila, Bandar and Bhalu dance, Kaharwa dance, Dhobiya dance, Kirtan dance, Ahirwa Dance. Folk songs , namely , Kajri, Barahmasi, Chaumas, Phagua, Kahrava, Birha, Kawwali, Alha, Kirtan, Jogia, Bhajan, Kavi sammelan, Musayara also have gained popularity.
Due to integrity with Azamgarh, this Katghar Lalganj also follows the same tradition. Main industries include chemicals, food, Benarasi sarees, and black potteries.
Songs and dances form a part and parcel of the people of this district. People gets enthrall with the mood of varied dance forms like Nautanki, Ramlila, Krishnalila, Bandar and Bhalu dance, Kaharwa dance, Dhobiya dance, Kirtan dance, Ahirwa Dance. Folk songs , namely , Kajri, Barahmasi, Chaumas, Phagua, Kahrava, Birha, Kawwali, Alha, Kirtan, Jogia, Bhajan, Kavi sammelan, Musayara also have gained popularity.